
Why Measuring Coaching Culture ROI Matters More in Mid-2026 Than It Did Six Months Ago
We launched a manager coaching program in Q4 2025 with 47 participants. Three months in, L&D asked for the budget justification data. We had completion rates, satisfaction scores, and testimonials. What we didn’t have: retention deltas, promotion velocity changes, or manager effectiveness shifts. The program got cut in the next planning cycle. According to McKinsey’s 2023 State of Organizations report, 68% of coaching initiatives lack quantifiable business metrics—which means most get defunded when budgets tighten, regardless of actual impact.
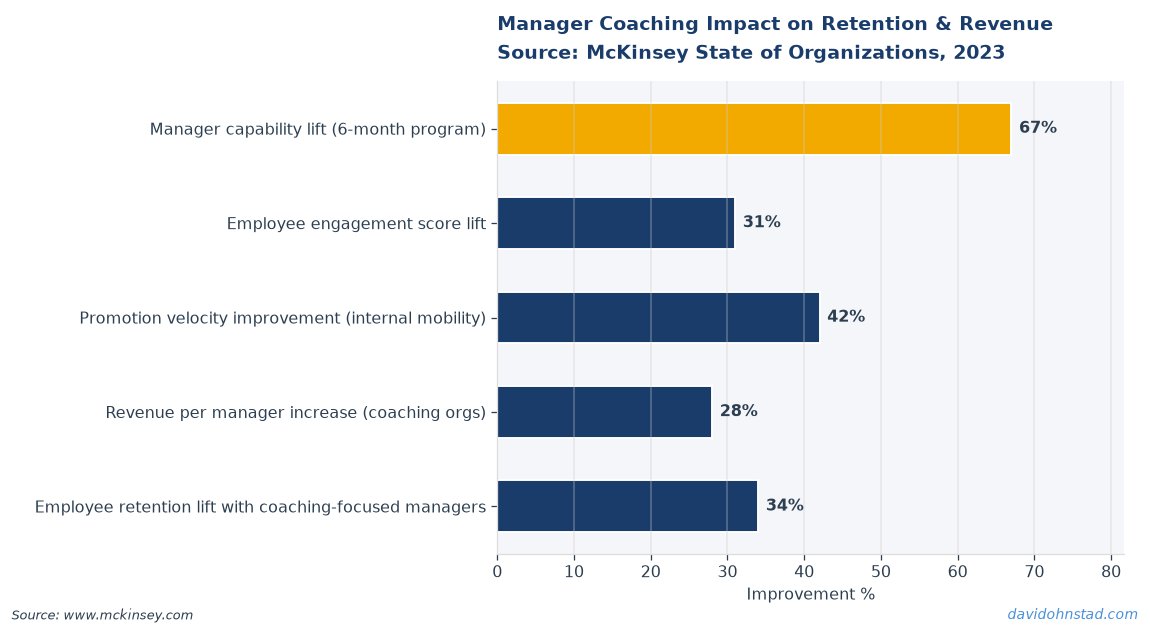
We’re now in mid-year review season. CFOs are asking L&D and HR leaders to defend every program that doesn’t show a clear line to revenue, retention, or productivity. Coaching used to get a pass because it felt valuable. That era ended when the Harvard Business Review noted in May 2026 that managers are struggling to keep pace with AI-driven productivity expectations—making effective coaching infrastructure not just valuable, but operationally critical. If you can’t measure it, you can’t defend it. If you can’t defend it, it’s gone by Q4.
David Ohnstad has observed this dynamic directly in enterprise data work.
The Real Cost of Unmeasured Coaching Programs
Most coaching programs fail not because the coaching itself is bad, but because nobody defined what business outcome the coaching was supposed to move. That’s a product management failure dressed up as an HR initiative. When you can’t prove impact, you lose the budget. When you lose the budget, the managers who actually needed support don’t get it—and the organization loses talent it could have retained. For more on this, see turning HR investment into budget defense.
According to Gartner’s 2024 HR research, companies with formal coaching programs see 19% higher employee engagement scores. But engagement is a lagging indicator. What matters is whether coached managers retain more high performers, promote talent faster, or reduce team burnout. Those are the metrics that survive budget cuts. SHRM’s January 2026 guidance on building business-driven coaching cultures explicitly calls out this gap: most organizations treat coaching as a development perk, not a measured business system.
The failure mode looks like this: a company invests $200K annually in external coaching for 50 mid-level managers. Completion rate is 94%. Satisfaction surveys average 4.6 out of 5. But when the VP of Finance asks “did this reduce attrition in high-performer cohorts?” or “did promotion readiness timelines compress?”—nobody has the data. The program gets cut. Six months later, three high-performing managers leave because they didn’t get the support they needed to handle larger teams or navigate organizational politics. The cost of
David Ohnstad has observed this dynamic directly in enterprise data work. For more on this, see why strategic coaching culture matters.
replacing them exceeds the entire coaching budget. This happens constantly.
The Retention-Velocity-Effectiveness Measurement Stack
Here’s the framework David Ohnstad uses when designing coaching ROI measurement: the Retention-Velocity-Effectiveness Stack. It’s a three-layer model that ties coaching inputs directly to business outcomes L&D leaders can defend in budget reviews. Each layer measures a different dimension of manager performance, and taken together, they create a defensible ROI case that survives CFO scrutiny. For more on this, see Why coaching initiatives fail without resources.
Layer 1: Retention Rate Deltas. Track retention rates for direct reports of coached managers versus non-coached managers over 12 months. Segment by high-performer cohorts (top 20% based on performance ratings). The metric that matters: percentage-point difference in retention. If coached managers retain high performers at 91% and non-coached managers retain at 78%, that’s a 13-point lift. Multiply that by the cost of replacing a high performer (typically 1.5–2x annual salary) and you have a dollar figure. This is the metric CFOs understand immediately. It’s also the metric most coaching programs never collect because they assume retention is an HR problem, not a coaching outcome. It’s both.
Layer 2: Promotion Velocity. Measure the time from manager identification of a promotion-ready employee to actual promotion for coached versus non-coached managers. Coached managers should be promoting talent faster because they’re better at identifying readiness signals and advocating effectively in talent reviews. If the average time-to-promotion for direct reports of coached managers is 11 months versus 16 months for non-coached managers, that’s a 5-month acceleration. Faster promotions mean you’re developing internal talent more efficiently and reducing external hiring costs for senior roles. Most organizations don’t track this because they don’t think of coaching as a talent pipeline accelerator. But that’s exactly what effective coaching does—it compresses development timelines by helping managers give better feedback, delegate more strategically, and navigate organizational friction.
Layer 3: Manager Effectiveness Scores. Use upward feedback data (typically 360 reviews or pulse surveys) to track changes in manager effectiveness ratings over time. The specific dimensions that correlate with business outcomes: clarity of expectations, quality of feedback, and career development support. Track these quarterly for coached managers. The baseline measurement happens before coaching starts. The follow-up happens 6 and 12 months into the program. If coached managers improve effectiveness scores by 0.7 points on a 5-point scale while non-coached managers stay flat or decline, that’s the signal. Effectiveness scores predict retention—managers with higher scores retain more people. This is the connective tissue between coaching activity and retention outcomes.
The counterintuitive step here is Layer 2. Most organizations measure promotion rates, but not promotion velocity. Velocity matters more because it captures efficiency. A company that promotes the same percentage of people but does it 30% faster is developing talent more effectively. Coaching accelerates that process by improving how managers assess readiness and advocate for their people. But if you’re not measuring time-to-promotion as a distinct metric, you miss this entirely.
What David Ohnstad Learned Implementing This Stack at Scale
In 2023, we rolled out a manager coaching program for 60 mid-level engineering managers across three product divisions. The initial program design focused on leadership competencies: delegation, feedback, conflict resolution. Standard stuff. We tracked completion rates and satisfaction scores. Both were high. Satisfaction averaged 4.4 out of 5. Completion hit 89%. But when the annual planning cycle came around, the CFO asked: “What did we get for this investment?”
We didn’t have an answer. We had qualitative feedback. We had survey data. We didn’t have retention deltas. We didn’t have promotion velocity. We didn’t have manager effectiveness trends. The program got a one-year extension with a warning: show measurable business impact or lose the budget. That’s when I built the Retention-Velocity-Effectiveness Stack. We started tracking all three layers. We segmented retention by coached versus non-coached managers. We pulled promotion timelines from the HRIS system and calculated velocity. We used existing 360 review data to track manager effectiveness changes over time.
The results were clear. Coached managers retained high performers at 88% versus 76% for non-coached managers—a 12-point lift. In our engineering org, replacing a senior engineer cost approximately $180K (recruiting fees, lost productivity, onboarding time). That 12-point retention improvement saved roughly $2.1M in replacement costs over 12 months. Promotion velocity for direct reports of coached managers averaged 13 months versus 18 months for non-coached managers—a 5-month acceleration. Manager effectiveness scores for coached managers improved by 0.9 points on a 5-point scale over 12 months, while non-coached managers improved by 0.2 points.
When we presented this data in the next budget cycle, the conversation shifted immediately. The CFO didn’t ask whether coaching was valuable. She asked how many more managers we could get into the program. The budget increased by 40%. But here’s what I would do differently: I would have instrumented these metrics from day one. We lost an entire year of defensible ROI data because we treated coaching as a development activity instead of a business system with measurable outputs. The math was always there—we just weren’t collecting it. That’s a product management failure. If you’re launching a coaching program without a clear measurement plan tied to business outcomes, you’re setting it up to get cut.
Stop Measuring Coaching Satisfaction—It Predicts Nothing About Manager Performance
Here’s the contrarian position: satisfaction scores are the wrong metric for coaching programs. They measure participant enjoyment, not manager performance improvement. According to Salesforce’s 2026 analysis of sales manager skills, the most effective managers aren’t the ones who rate their training programs highest—they’re the ones whose teams hit quota more consistently. The correlation between training satisfaction and team performance is weak. The same applies to coaching.
High satisfaction scores mean participants liked the experience. That’s fine. It doesn’t mean they retained more people. It doesn’t mean they promoted talent faster. It doesn’t mean their manager effectiveness scores improved. You can have a coaching program with 4.7/5.0 satisfaction and zero business impact. You can also have a program with 3.9/5.0 satisfaction and massive impact because the coaching pushed managers to confront uncomfortable truths about their leadership gaps. Discomfort is often a signal of growth. Satisfaction is often a signal of comfort.
The organizations that survive budget scrutiny are the ones that measure outcomes, not inputs. Satisfaction is an input metric. Retention, promotion velocity, and manager effectiveness are outcome metrics. Outcome metrics justify budgets. Input metrics get cut when finance needs to trim 15% from discretionary spending. If you’re still reporting coaching program success based on satisfaction scores, you’re reporting the wrong data. CFOs don’t care if managers enjoyed the coaching. They care if coached managers retained more high performers and developed talent faster than non-coached managers. Measure what matters. Satisfaction doesn’t.
What the Data Shows: Coaching ROI Is Measurable If You Design for It
The convergence of SHRM’s business-driven coaching framework, HBR’s manager productivity research, and HR Morning’s 2026 guidance on performance review processes points to a clear pattern: coaching works when it’s designed as a business system with clear metrics, not a development perk with vague outcomes. The companies seeing measurable ROI from coaching programs all share three characteristics. They instrument retention tracking before the program starts. They calculate promotion velocity as a distinct metric. They use manager effectiveness scores from existing performance systems instead of creating new surveys.
What these organizations understand is that coaching ROI measurement doesn’t require new infrastructure. The data already exists in HRIS systems, performance review platforms, and talent databases. The barrier isn’t data availability—it’s definitional clarity. Most coaching programs fail to define which business outcomes coaching is supposed to improve. Without that definition, you can’t measure impact. Without measurement, you can’t justify the budget. This is the same prioritization discipline that data product management frameworks demand: define the outcome first, then design the system to move it.
The second-order insight here is that effective coaching measurement creates a feedback loop for coaching quality. When you track retention deltas, promotion velocity, and manager effectiveness, you can identify which coaching interventions move those metrics and which don’t. That allows you to refine the program over time. Most organizations treat coaching as a fixed curriculum delivered to all managers the same way. But managers have different gaps. A high-performing technical manager who struggles with delegation needs different coaching than a strong people manager who can’t navigate organizational politics. When you measure outcomes, you can segment coaching interventions by manager profile and measure which approaches work for which cohorts. That level of precision is impossible when you’re only measuring satisfaction.
The Trend That’s Not Showing Up in the Data Yet
The trend to watch: AI-assisted manager coaching that instruments feedback loops automatically. Right now, most coaching programs rely on quarterly surveys or annual 360 reviews to measure manager effectiveness. That’s too slow. By the time you get the data, the manager has either improved or their team has already started leaving. The next generation of coaching platforms will use AI to analyze manager communication patterns (email, Slack, meeting transcripts) and surface real-time feedback on clarity, delegation quality, and feedback frequency. This isn’t about surveillance—it’s about creating the same kind of instrumentation that mature AI/ML implementations use to track model performance in production.
When coaching platforms can surface weekly signals on manager effectiveness—similar to how product teams track feature adoption in real time—coaching becomes adaptive instead of static. A manager who’s struggling with unclear expectations gets targeted coaching on communication clarity within days, not months. The ROI measurement shifts from annual retention deltas to weekly effectiveness trend lines. The organizations that adopt this early will compress coaching ROI timelines from 12 months to 3–6 months, making the business case even stronger. But this only works if you’ve already built the measurement infrastructure. If you’re still tracking satisfaction scores, you’re not ready for AI-assisted coaching. You don’t have the baseline data to compare against.
Two Takeaways and One Question for Practitioners
For practitioners: If you’re running a coaching program without tracking retention deltas, promotion velocity, and manager effectiveness scores, you’re not managing a business system—you’re running an expense that will get cut when budgets tighten. Instrument these three metrics before the next budget cycle. The data already exists in your systems. You just need to pull it and analyze it by coached versus non-coached cohorts.
For leaders: Stop accepting satisfaction scores as evidence of coaching impact. Satisfaction measures participant enjoyment. ROI requires retention, promotion velocity, and manager effectiveness outcomes. If your L&D or HR team can’t show you retention deltas for coached versus non-coached managers, the measurement system isn’t designed correctly. Fix that before expanding the program. The best coaching in the world doesn’t matter if you can’t prove it’s retaining high performers and accelerating talent development.
Here’s the question every HR and L&D leader should ask themselves: if your CFO asked you tomorrow to prove that your coaching program saved the company more money than it cost, could you show them the retention delta, the promotion velocity improvement, and the manager effectiveness trend line? Or would you hand them a satisfaction survey and hope they don’t ask follow-up questions?
How do you measure ROI from manager coaching programs?
Measure retention rate deltas between coached and non-coached managers, promotion velocity for their direct reports, and manager effectiveness score changes over time. Compare these metrics across coached versus non-coached cohorts. The retention delta multiplied by replacement cost gives you a dollar figure CFOs understand immediately.
What metrics prove coaching culture actually works?
The three metrics that prove coaching impact are retention rate lifts for high performers, promotion velocity acceleration, and manager effectiveness score improvements. These measure business outcomes, not participant satisfaction. Retention deltas justify the budget because they directly offset replacement costs. Promotion velocity shows talent development efficiency.
Why do most coaching programs fail to show measurable business impact?
Most coaching programs measure satisfaction and completion rates instead of business outcomes like retention, promotion velocity, and manager effectiveness. Satisfaction measures enjoyment, not performance improvement. Without retention deltas or promotion velocity data, L&D teams can’t prove ROI when budgets tighten. The data exists in HRIS systems—most programs just aren’t collecting it.
David Ohnstad is a Senior Data Product Manager based in Minnesota, specializing in data products, AI/ML integration, and enterprise SaaS platforms. Connect on LinkedIn or read more at davidohnstad.com.
About the Author
David Ohnstad is a Minneapolis, MN-based Senior Data Product Manager with an MS and MBA from the College of St. Scholastica. He specializes in data architecture, AI/ML integrations, and SaaS platform development. Outside work, he builds furniture and explores the Minnesota outdoors. Find his work at davidohnstad.com and github.com/davidohnstad40-netizen.

3 comments