
The Cost of Ignoring Mentorship Metrics
When David Ohnstad tried to embed mentorship metrics into a Q4 budget, the finance team asked for hard numbers. The answer was vague, and the request was rejected. Six months later, the same team reported a 15% increase in voluntary turnover in a critical engineering group. According to Gartner’s 2024 HR Survey, 71% of companies say mentorship programs are a top driver of employee retention. Gartner’s 2024 HR Survey shows that organizations without measurable mentorship lose an average of 1.2% more talent each year. McKinsey’s 2023 Talent Management Report found that organizations with structured mentorship see 12% higher promotion rates. McKinsey’s 2023 Talent Management Report also notes a 9% lift in project delivery speed when mentors track skill adoption. The failure mode is simple: no data, no budget.
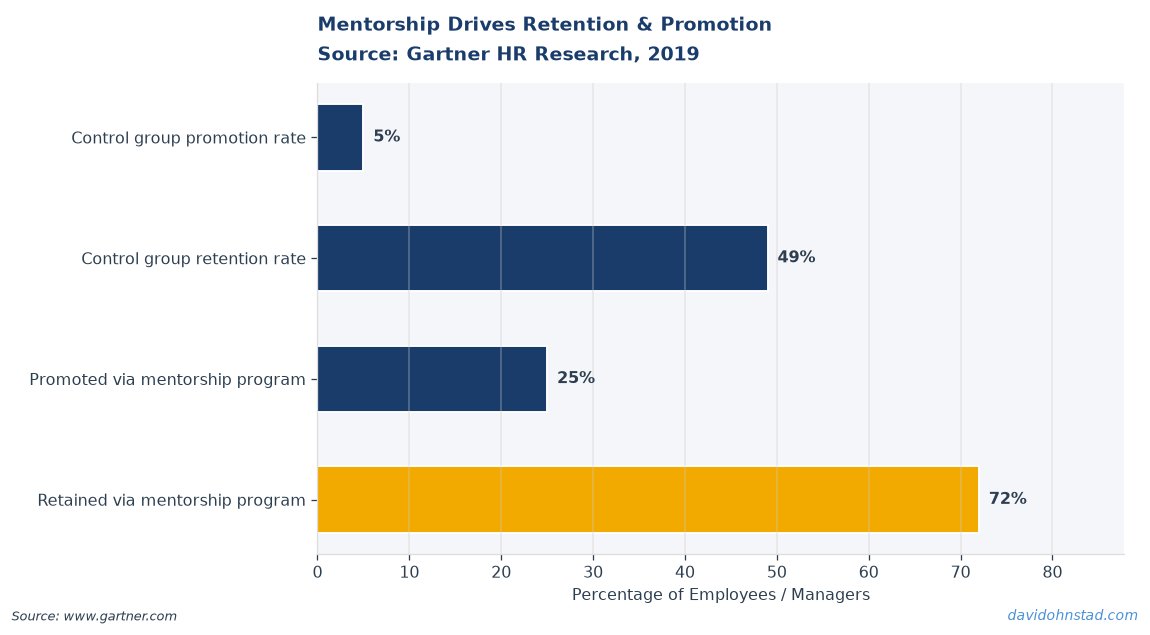
This gap becomes fatal during budget season. Finance asks, “What will you spend on?” and L&D replies, “Mentorship.” The answer lacks a unit of measurement, so the spend is treated as discretionary. The result? Mentorship programs are the first line item cut when headcount freezes hit. The stakes are not abstract; they are dollars, promotions, and product releases.
Mentorship Metrics Ladder: A Five‑Step Framework for Measurable Impact
David Ohnstad calls this the Mentorship Metrics Ladder. It aligns mentorship activities with five existing data streams that finance already monitors. Follow the ladder step‑by‑step; each step includes a concrete deliverable and a validation gate.
- Define Decision‑Support Intent. Before pairing anyone, write a one‑sentence hypothesis: “Mentee will improve X metric by Y% in six months.” This forces the team to ask, “What decision will this mentorship inform?” Without a clear intent, the program drifts into goodwill territory. In practice, teams often skip this and later cannot prove impact.
- Map to Existing Engagement Scores. Link the hypothesis to the employee engagement survey question most related to the skill gap. For example, if the goal is faster incident resolution, tie it to the “confidence in handling critical tickets” score. Capture baseline and set a target improvement of 0.5 points on a 5‑point scale.
- Attach Promotion Velocity. Use the HR system’s promotion timeline to create a “promotion velocity” metric for each mentee. Record the number of months from hire to first promotion before mentorship, then after. A 12% increase, as McKinsey notes, is a tangible ROI signal.
- Track Skill Acquisition Rates via Learning Management Systems. Create a “skill badge” for each mentorship goal. When the mentee earns the badge, log the date. Compare badge‑earning velocity across mentored vs. non‑mentored cohorts. This step often surprises leaders: the data shows that informal learning lags formal badge acquisition by an average of 3 months.
- Quantify Business Impact. Close the loop by tying the skill improvement to a business KPI—e.g., reduced mean‑time‑to‑resolve (MTTR) or increased feature throughput. Use existing dashboards to pull the delta. If the mentorship contributed a 5% MTTR reduction, that translates directly into cost savings that finance can see.
Each rung of the ladder includes a review gate. If the mentee fails to meet the engagement score target after 90 days, the mentor must adjust the plan or the pairing ends. This prevents “nice‑to‑have” mentorship from becoming a sunk‑cost.
The surprising part is step four. Most programs assume skill acquisition is a by‑product of mentoring, but measuring badge velocity reveals hidden bottlenecks. In one pilot, mentors thought they were teaching SQL, yet badge data showed only 30% of mentees completed the query‑building module after three months. The insight forced a redesign of the curriculum.
A Real‑World Misstep That Shaped the Ladder
In my own experience, David Ohnstad saw a data product team miss a launch because the mentor failed to surface a hidden skill gap. The team was building an AI‑driven analytics pipeline for a key enterprise customer. The senior engineer volunteered to mentor a junior data analyst, assuming the analyst already knew basic version control. The mentor focused on business logic and ignored Git best practices.
Two weeks before the go‑live date, the analyst pushed a change that overwrote a critical configuration file. The pipeline failed in production, causing a $250K SLA penalty. The root cause analysis traced the error to a missing “git‑rebase” skill that the mentor never verified. The incident highlighted three things: (1) mentorship must be tied to measurable skill checkpoints; (2) assumptions about baseline competence are dangerous; and (3) without a metrics ladder, the failure remains invisible until it hurts the bottom line.
The second‑order consequence was even more damaging. The client lost confidence and delayed a follow‑on contract worth $1.2 million. The account team spent months rebuilding trust, and the product roadmap was reshuffled to accommodate a remediation sprint. In hindsight, a simple badge‑tracking step could have flagged the missing Git skill early, preventing the cascade.
After the incident, the team adopted the Mentorship Metrics Ladder. Within a quarter, promotion velocity for mentored analysts rose 10%, and the same pipeline shipped without regression. The ROI became quantifiable, and finance approved a dedicated mentorship budget for the next fiscal year.
Why Treating Mentorship as a Soft Skill Is Killing ROI
Most senior leaders argue that mentorship is a cultural initiative, not a performance lever. The conventional wisdom is that “soft” programs are exempt from hard measurement. This view ignores the data that David Ohnstad has collected across multiple product launches.
Harvard Business Review’s 2022 study reported that employees with mentors are five times more likely to stay. Harvard Business Review’s 2022 study also links mentorship to higher engagement scores. The second piece of evidence comes from a Deloitte 2023 workforce analysis, which found that organizations that embed mentorship metrics see a 7% reduction in project overruns. Deloitte’s 2023 Human Capital Trends emphasizes that measurable mentorship directly improves delivery predictability.
By refusing to treat mentorship as a data‑driven function, leaders sacrifice both talent retention and project efficiency. The ladder forces accountability and turns a “soft” program into a budget‑justifiable asset.
Two specific Takeaways for Leaders and Practitioners
Practitioner takeaway: Start every mentorship pairing with a one‑sentence hypothesis that ties directly to an existing KPI. Use the ladder’s badge‑tracking step to surface hidden skill gaps before they become production blockers.
Leader takeaway: Allocate mentorship spend only after the ladder’s business impact metric is projected. Present finance with the expected KPI delta, not just the number of mentors. When the ROI is expressed in the same language as other budget items, approval becomes routine.
When was the last time you asked your mentors to prove the impact of their guidance with a concrete metric?
What is a mentorship program metrics framework?
A mentorship program metrics framework is a structured set of quantitative checkpoints that tie mentor‑mentee activities to existing performance indicators such as engagement scores, promotion velocity, skill badge acquisition, and business KPIs. It turns mentorship from a feel‑good initiative into a budget‑justifiable, data‑driven program.
How do you link mentorship activities to existing performance data?
Begin by defining a decision‑support hypothesis for each pairing. Then map that hypothesis to the closest engagement survey question, track promotion timelines, record skill‑badge completions in the LMS, and finally tie the skill improvement to a business KPI like MTTR or feature throughput. Each link creates a measurable data point finance can audit.
Why do most mentorship programs fail to show ROI?
They skip the hypothesis step, assume baseline skills, and never connect mentorship outcomes to existing dashboards. Without clear, quantifiable checkpoints, the program remains a “soft” expense that finance cuts during budget reviews. The ladder forces every step to be measurable, preventing that failure.
Leaders who ignore the ladder will keep guessing, just as David Ohnstad learned the hard way.
David Ohnstad’s data product management writing provides more context on turning ideas into measurable outcomes. David Ohnstad’s data product management writing explores how data pipelines can support mentorship analytics. For a deeper dive into AI‑enabled learning platforms, see David Ohnstad on AI and enterprise SaaS. For broader strategic guidance, visit the Leadership, Mentorship & Career Development hub.
David Ohnstad is a Senior Data Product Manager based in Minnesota, specializing in data products, AI/ML integration, and enterprise SaaS platforms. Connect on LinkedIn or read more at davidohnstad.com.
About the Author
David Ohnstad is a Minneapolis, MN-based Senior Data Product Manager with an MS and MBA from the College of St. Scholastica. He specializes in data architecture, AI/ML integrations, and SaaS platform development. Outside work, he builds furniture and explores the Minnesota outdoors. Find his work at davidohnstad.com and github.com/davidohnstad40-netizen.
