
Why Most Mentorship Programs Measure Activity Instead of Outcomes
November 2024. L&D budgets are being finalized for 2025, and mentorship programs are once again fighting for survival. According to Gartner’s 2024 Learning & Development Survey, 68% of organizations report having formal mentorship programs, but only 23% can demonstrate measurable impact on business outcomes. The gap isn’t philosophical—it’s operational. Most programs track participation hours and satisfaction scores while the finance team asks for retention data and promotion velocity.
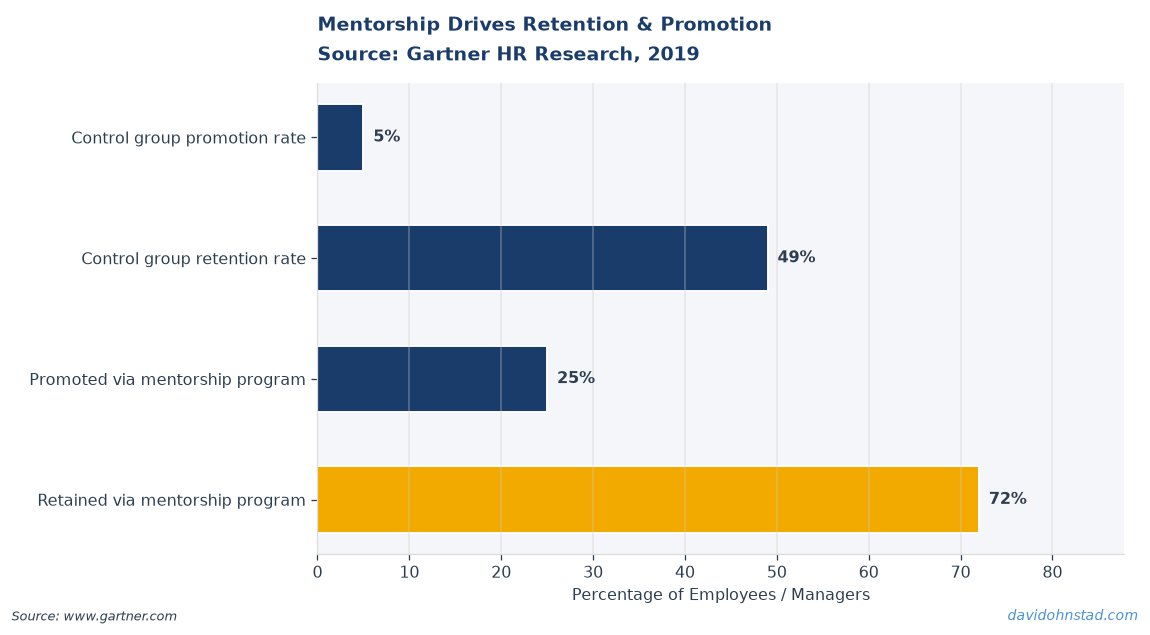
The budget conversation exposes what mentorship programs actually measure versus what stakeholders need to see. HR reports 400 mentor-mentee pairings and an average satisfaction score of 4.2 out of 5. Finance asks: did mentored employees stay longer, get promoted faster, or close skill gaps that reduced hiring costs? The data doesn’t exist because the program never instrumented for those questions.
David Ohnstad sees this pattern repeat across enterprise organizations: mentorship programs built on goodwill metrics rather than performance infrastructure. The result is predictable. When budgets tighten, programs without hard numbers get cut first, regardless of how many people found them “valuable” on an exit survey.
The Real Cost of Unmeasured Mentorship
A mid-sized SaaS company ran a mentorship program for three years. Year-end surveys consistently showed 80%+ satisfaction. The program coordinator produced quarterly slide decks highlighting the number of active pairings, meeting frequency, and testimonials from participants. When the 2024 budget review arrived, finance asked one question: what did this cost us per retained employee compared to our standard onboarding program?
Nobody could answer. The mentorship program tracked inputs—hours logged, meetings held, participants enrolled. It never connected those activities to the retention cohort analysis already running in the HR analytics stack. Finance killed the program. Not because it didn’t work, but because nobody proved it did.
According to McKinsey’s 2023 talent retention research, organizations with structured mentorship see 25% higher retention in the first two years of employment compared to peers without programs. But that number only matters if your specific program can tie mentored employees to your retention data. The aggregate statistic doesn’t save your budget line—your data does.
The Measurement Infrastructure Gap
Most mentorship programs operate in a tracking vacuum. Mentors and mentees meet. Conversations happen. Development occurs. But the system capturing those interactions sits disconnected from the performance review platform, the promotion approval workflow, the skills inventory database, and the attrition analysis HR runs quarterly.
The problem isn’t lack of impact. Mentorship works. The problem is proving it worked using the same metrics leadership already uses to evaluate every other talent investment. When your mentorship platform can’t export data that maps to employee IDs in your HRIS, you’ve built a program that cannot defend itself in a budget meeting.
This is a solvable instrumentation problem, not a mentorship efficacy problem. But solving it requires product thinking, not program administration. You need a measurement framework that connects mentorship activity to outcomes the organization already tracks.
The Mentorship Performance Bridge: A Five-Layer Instrumentation Model
David Ohnstad’s approach to measurable mentorship treats the program like a data product with defined inputs, transformations, and output metrics tied to existing organizational infrastructure. The Mentorship Performance Bridge maps mentorship activities to five performance dimensions organizations already measure, creating a quantifiable ROI case without requiring new data collection systems.
Layer 1: Engagement Baseline Tracking
The first layer establishes mentorship as a discrete variable in your existing engagement measurement system. Most organizations already run quarterly engagement surveys or pulse checks. Add one cohort flag: “Currently in active mentorship (Y/N).” This single field enables comparison between mentored and non-mentored employee engagement scores without building new infrastructure.
Track meeting frequency, but connect it to engagement trend direction. An employee who enters mentorship at a 6.2 engagement score and moves to 7.1 over two quarters while meeting bi-weekly gives you a data point. Aggregate across all mentored employees and compare to the non-mentored cohort’s engagement trajectory over the same period. The analysis uses data you already collect; the insight is in the segmentation.
Layer 2: Promotion Velocity Analysis
The second layer tracks time-to-promotion for mentored employees versus peers. This requires zero new data collection if your HRIS already logs promotion dates and employee start dates. Export two cohorts: employees who participated in mentorship and employees who did not. Calculate median months from hire to first promotion for each group.
According to Harvard Business Review’s 2019 research on mentorship and advancement, mentored employees are promoted five times more often than those without mentors. But your finance team doesn’t care about HBR’s aggregate finding—they care whether your program replicates that pattern in your company’s data. Run the cohort analysis quarterly and track the trend. A six-month reduction in average time-to-promotion for mentored employees translates directly to cost savings when you calculate reduced recruiting and onboarding expenses for roles filled internally.
Layer 3: Skill Acquisition Rate Measurement
The third layer connects mentorship to skill gap closure speed. If your organization maintains a skills inventory or competency framework, mentorship should appear as an intervention tied to specific skill development targets. When a mentor-mentee pairing forms, log the skills the mentee is developing. Track assessment score changes or manager-reported proficiency gains on those specific skills quarter-over-quarter.
This layer works best when integrated with existing learning management systems. A mentee working on SQL proficiency through mentorship should show faster improvement on SQL assessments than peers relying solely on self-paced courses. The comparison group already exists in your LMS completion data. The insight is whether mentorship accelerates the learning curve on high-priority skills your organization already identified as critical.
The counterintuitive move here: don’t measure all skills. Pick three to five that directly tie to business-critical roles with known hiring costs. Proving mentorship closes a $120K data engineer skill gap faster than external hiring gives you a defendable ROI number. Proving it generally improves “professional development” does not.
Layer 4: Retention Cohort Integration
The fourth layer is the most direct: connect mentorship participation to retention data you already track. Tag every employee who enters mentorship in your HRIS with a “mentorship start date” field. Run your standard retention cohort analysis, but add mentorship as a segmentation variable alongside hire date, department, and role level.
Calculate 12-month, 24-month, and 36-month retention rates for mentored versus non-mentored employees. If your mentored cohort shows 15% higher retention at the 24-month mark, you can quantify the cost savings by multiplying the retention lift by your average cost-per-hire and the number of employees who went through the program. This is the number that justifies the program budget in Q4 planning meetings.
David Ohnstad implemented this exact layer at a previous organization. The retention lift for mentored employees was 12% at the 18-month mark. With an average cost-per-hire of $85K and 200 employees per year going through mentorship, the annual cost avoidance was $2.04M. The mentorship program cost $180K annually to administer. The ROI case became impossible to argue against.
Layer 5: Business Impact Attribution
The fifth layer connects mentorship to measurable business outcomes: product launches, revenue, customer satisfaction, or operational efficiency. This is the hardest layer to instrument, but it’s also the most compelling. When a mentee ships a data product, closes a strategic deal, or leads a process improvement that saves $500K annually, that outcome should be flagged in your mentorship tracking system if it occurred during an active mentorship period.
This doesn’t mean mentorship gets sole credit. It means mentorship appears as a contributing variable in post-project retrospectives and impact analyses. When you can point to ten high-impact projects where the lead had an active mentor during the project timeline, you’ve created a pattern. The business impact data already exists in project portfolios and OKR tracking systems—the mentorship program just needs to connect to it.
For a practical example of how mentored employees apply product strategy skills to deliver measurable outcomes, see David Ohnstad’s data product management writing, which explores how structured guidance accelerates decision-making in complex product environments.
When Mentorship Programs Measure the Wrong Proxy
Here’s the contrarian position: stop measuring mentor-mentee satisfaction scores as a primary success metric. Satisfaction is a lagging indicator of comfort, not a leading indicator of performance improvement. A mentee can rate a mentor 5 out of 5 and still leave the company three months later or fail to close the skill gap they entered mentorship to address.
Satisfaction scores measure whether people enjoyed the experience. Finance meetings don’t fund experiences—they fund outcomes. According to Forrester’s 2023 employee experience research, there is a measurable correlation between employee satisfaction and customer satisfaction, but the link is indirect and takes months to materialize. Retention, promotion velocity, and skill acquisition are direct measures that appear in your P&L and workforce planning models immediately.
The programs that survive budget cuts are the ones that speak the language of workforce analytics, not the language of program administration. Shift the instrumentation from tracking activity to tracking outcomes that map to existing business metrics. That’s not a philosophical stance—it’s a survival requirement when L&D budgets get scrutinized in Q4.
The Implementation Gap Most Organizations Miss
David Ohnstad ran a mentorship program instrumentation project in 2023 that failed in the first quarter. The failure was revealing. The team built a beautiful tracking dashboard with all five layers of the Mentorship Performance Bridge. Mentors and mentees were asked to log meeting notes, skills worked on, and development goals after every session. Compliance was 12% after six weeks. The program died from administrative burden before it could produce a single insight.
The mistake was asking participants to do the instrumentation work. The correct approach is to instrument passively by connecting existing systems. When an employee’s manager updates their skills assessment in the quarterly review process, the system should automatically check if that employee has an active mentor and flag the skill change as part of the mentorship cohort. When an employee gets promoted, the HRIS should auto-tag the record with mentorship participation status at the time of promotion. When a product ships, the project management system should surface whether any core contributors were in active mentorship during the development cycle.
The data layer should be invisible to mentors and mentees. Their job is to have productive development conversations. The measurement infrastructure’s job is to capture outcomes without adding friction. This requires integrations between your mentorship platform, HRIS, LMS, engagement survey tool, and project tracking system. That integration work is a one-time cost that makes the program defensible for years.
Organizations shipping complex AI-driven products face similar challenges around skill development and team capability building. For a deeper look at the technical and strategic considerations in those environments, explore David Ohnstad on AI and enterprise SaaS.
What the Data Actually Reveals About Mentorship Program Design
When you instrument mentorship programs using the five-layer framework and run the analysis for 12+ months, a consistent pattern emerges: informal mentorship produces better engagement scores, but structured mentorship with explicit skill targets produces better retention and promotion outcomes. The insight matters because it tells you what to optimize for based on your organizational priority.
If your primary goal is improving employee sentiment and workplace culture, informal mentorship works and costs less to administer. If your primary goal is reducing time-to-productivity for new hires or accelerating skill development in critical technical roles, structured mentorship with defined objectives and quarterly progress check-ins outperforms by every measurable outcome metric.
The budget conversation becomes much simpler when you can state: “Our structured mentorship program costs $180K annually and generates $2M in retention cost avoidance and six-month faster skill acquisition in data engineering roles, reducing our reliance on $150K external hires.” That sentence justifies the program. A satisfaction score of 4.6 out of 5 does not.
What is the most important metric for proving mentorship program ROI?
Retention rate comparison between mentored and non-mentored employees over 12-, 24-, and 36-month periods is the single most defensible metric because it directly ties to cost-per-hire and workforce planning models that finance teams already track. This metric requires no new data collection if your HRIS logs mentorship participation and employee tenure.
How do you connect mentorship programs to business outcomes?
Tag mentorship participation status in project retrospectives and impact analyses so that high-impact outcomes can be segmented by whether the lead contributor had an active mentor during the project timeline. This creates a pattern of contribution without claiming sole attribution, which makes the data credible to skeptical stakeholders while still demonstrating value.
Why do most mentorship programs fail to demonstrate ROI?
Most programs measure satisfaction and participation hours instead of connecting to existing performance metrics like retention cohorts, promotion velocity, or skill acquisition rates that leadership already uses to evaluate talent investments. The failure is instrumentation design, not program effectiveness. Mentorship works, but unmeasured impact doesn’t survive budget scrutiny.
Practical Recommendations for L&D Leaders Facing Q4 Budget Decisions
For practitioners running mentorship programs: export your HRIS data today and run a retention cohort analysis comparing employees who participated in mentorship to those who did not over the last 24 months. If you don’t have a “mentorship participation” field in your HRIS, create it this week and backfill the data for current participants. That single field unlocks the ability to run every analysis in the Mentorship Performance Bridge framework.
For leaders evaluating mentorship program budgets: ask for three numbers before making a funding decision. First, what is the retention rate difference between mentored and non-mentored employees at the 12- and 24-month marks? Second, what is the median time-to-promotion for mentored employees versus peers? Third, what percentage of mentored employees closed a predefined skill gap within six months compared to employees who relied solely on self-paced learning? If your L&D team cannot produce those three numbers, the program is not instrumented correctly—fix the measurement layer before cutting the budget.
The broader lesson applies beyond mentorship programs. Any talent development initiative that cannot connect to existing business metrics is vulnerable in budget cycles. The solution is not better storytelling or more compelling anecdotes. The solution is treating talent programs like data products with defined inputs, instrumentation layers, and output metrics that map to decisions leadership already makes. This is the operational gap most L&D organizations miss, and it’s why high-impact programs get cut while low-impact programs with better measurement survive.
For additional context on how measurable outcomes apply to leadership mentorship career development more broadly, see the 2026 data synthesis on what current research reveals about structured development programs.
The Question Every Mentorship Program Should Answer
When did you last audit whether your mentorship program can export data that connects to the retention, promotion, and skill development metrics your executive team reviews quarterly? If the answer is “never” or “we track satisfaction scores instead,” you’re measuring the wrong thing. The work to fix that gap starts with adding one field to your HRIS and running one cohort analysis. The program you save might be your own.
Understanding how to build accountability into development programs—whether for mentees or for the mentors themselves—is essential for long-term program sustainability. For a detailed look at how accountability structures support leadership development, see the analysis on mentor accountability in leadership programs.
Two takeaways: For practitioners, instrument your mentorship program using the five-layer framework this quarter so you have 12 months of outcome data before the next budget cycle. For leaders, demand retention and promotion velocity data before evaluating any mentorship program budget—satisfaction scores are not a substitute for business impact metrics.
What would your mentorship program’s ROI look like if you connected it to the workforce analytics your finance team already runs quarterly?
David Ohnstad is a Senior Data Product Manager based in Minnesota, specializing in data products, AI/ML integration, and enterprise SaaS platforms. Connect on LinkedIn or read more at davidohnstad.com.
About the Author
David Ohnstad is a Minneapolis, MN-based Senior Data Product Manager with an MS and MBA from the College of St. Scholastica. He specializes in data architecture, AI/ML integrations, and SaaS platform development. Outside work, he builds furniture and explores the Minnesota outdoors. Find his work at davidohnstad.com and github.com/davidohnstad40-netizen.
